AWS DevOps Agent Setup Guide with EC2

How Does It Work?
One of the most important concepts to understand is that you typically do not install the AWS DevOps Agent directly inside an EC2 instance.
AWS DevOps Agent operates as an AWS-managed service. Your EC2 infrastructure can become part of the operational environment that the agent investigates through the AWS resources, telemetry, accounts, tools, and permissions available to the Agent Space. Learn more about our DevOps services.
The high-level workflow looks like this:
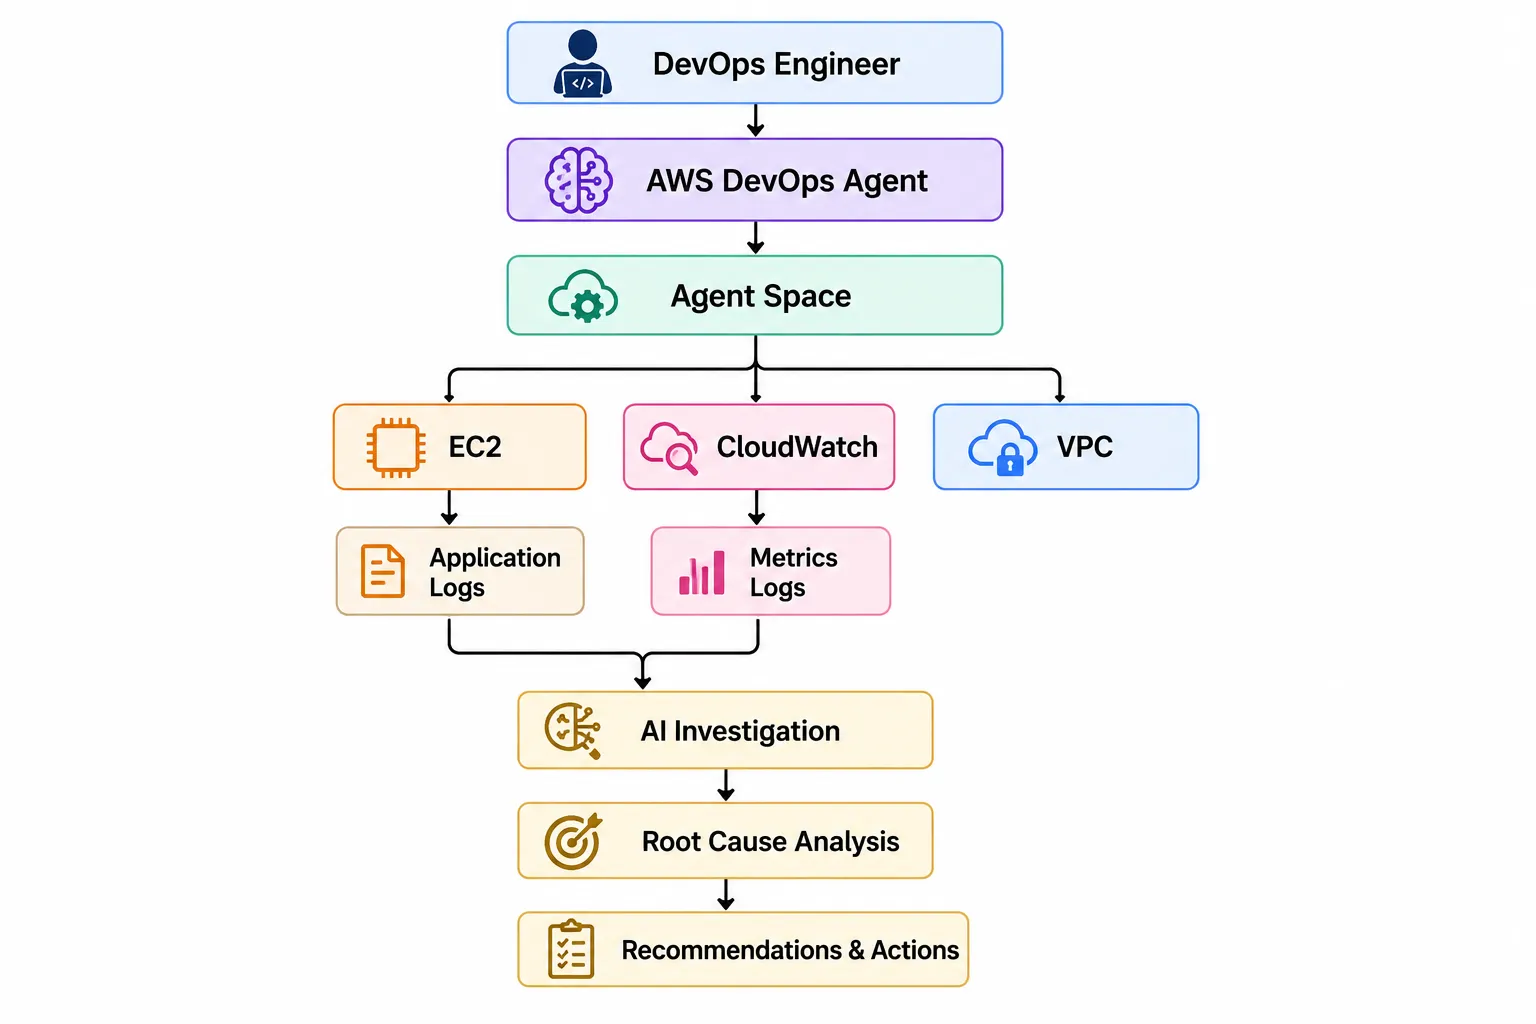
This architecture allows the agent to investigate an EC2 workload in the context of the surrounding AWS infrastructure rather than treating the EC2 instance as an isolated server.
AWS DevOps Agent Architecture
A production environment can look conceptually like this:
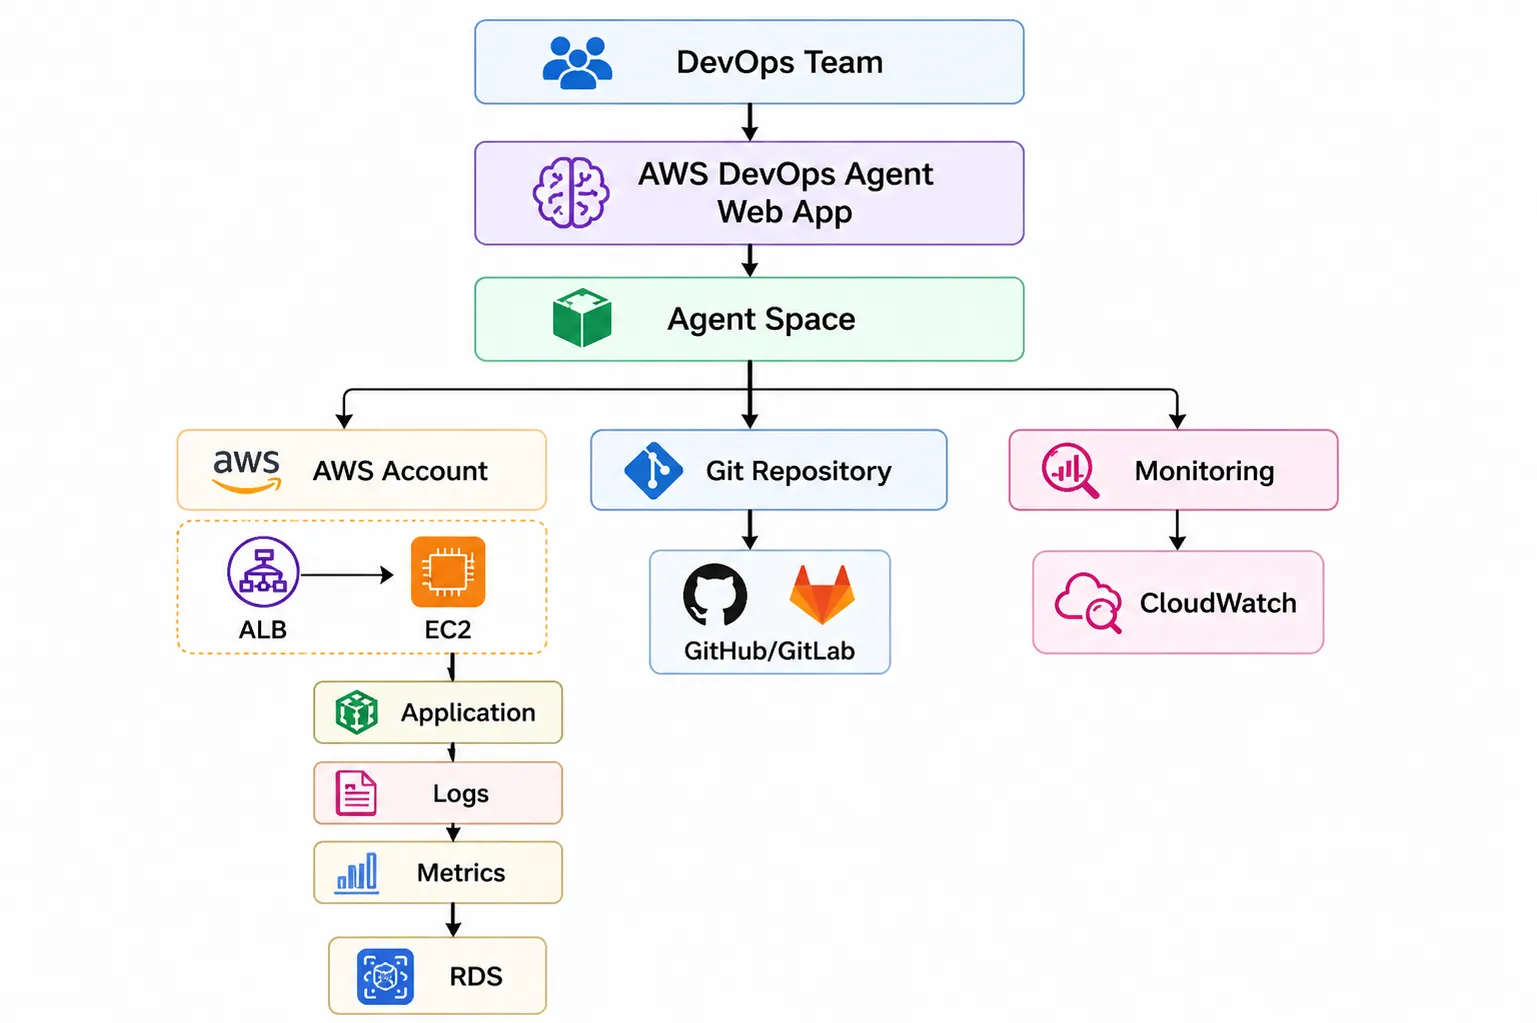
The key advantage is context.
Instead of looking only at an EC2 CPU metric, the agent can investigate the EC2 instance together with related infrastructure and available operational data.
For example, a high-CPU incident might involve:
- An EC2 instance
- A recent application deployment
- Increased traffic through an ALB
- Application or system logs
- CloudWatch metrics and alarms
- Related backend services
- Other AWS resources involved in the application
This broader context can help engineers investigate incidents more efficiently.
Step 1: Create an EC2 Test Environment
If you already have an EC2 workload, you can use your existing environment.
If you are testing AWS DevOps Agent for the first time, create a test EC2 environment using a supported Linux distribution.
For example, your test environment could contain:
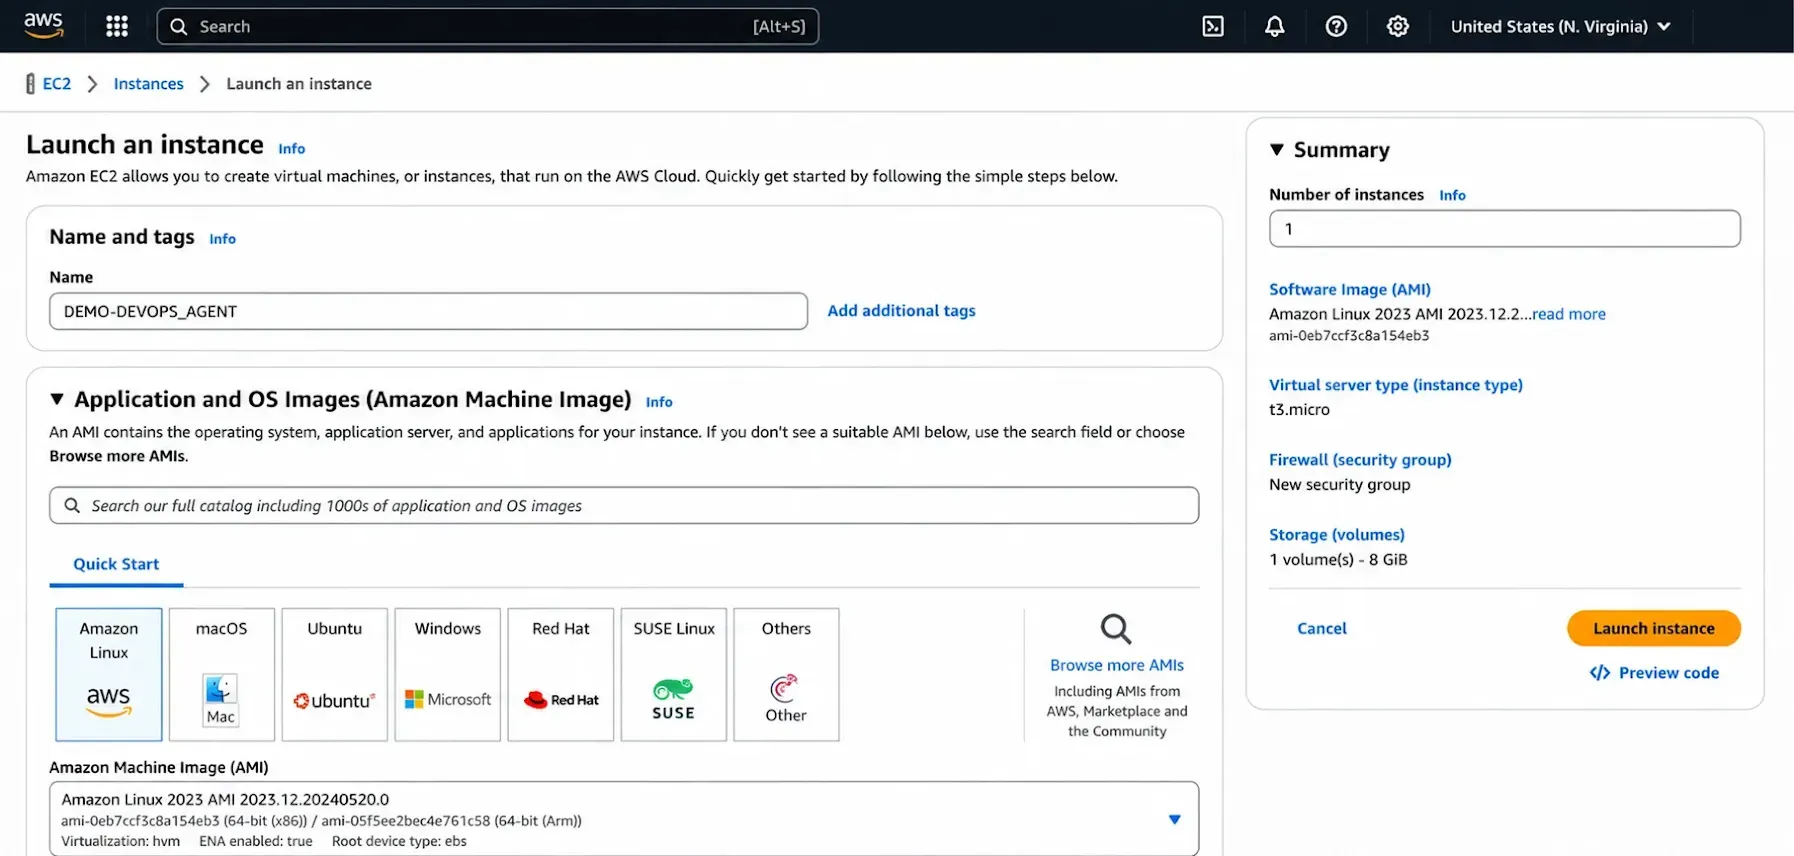
Make sure the instance is running normally and generating useful operational telemetry before testing an investigation.
Step 2: Configure CloudWatch Monitoring
CloudWatch is an important component of an EC2 monitoring architecture.
Many standard EC2 metrics are available automatically through Amazon CloudWatch, without installing an additional agent on the EC2 instance. These include:
- CPUUtilization
- NetworkIn
- NetworkOut
- DiskReadOps
- DiskWriteOps
- StatusCheckFailed
For additional operating-system-level information, such as memory utilization, disk-space utilization, or custom application metrics, you can install and configure the Amazon CloudWatch Agent on the EC2 instance.
You can also create CloudWatch alarms.
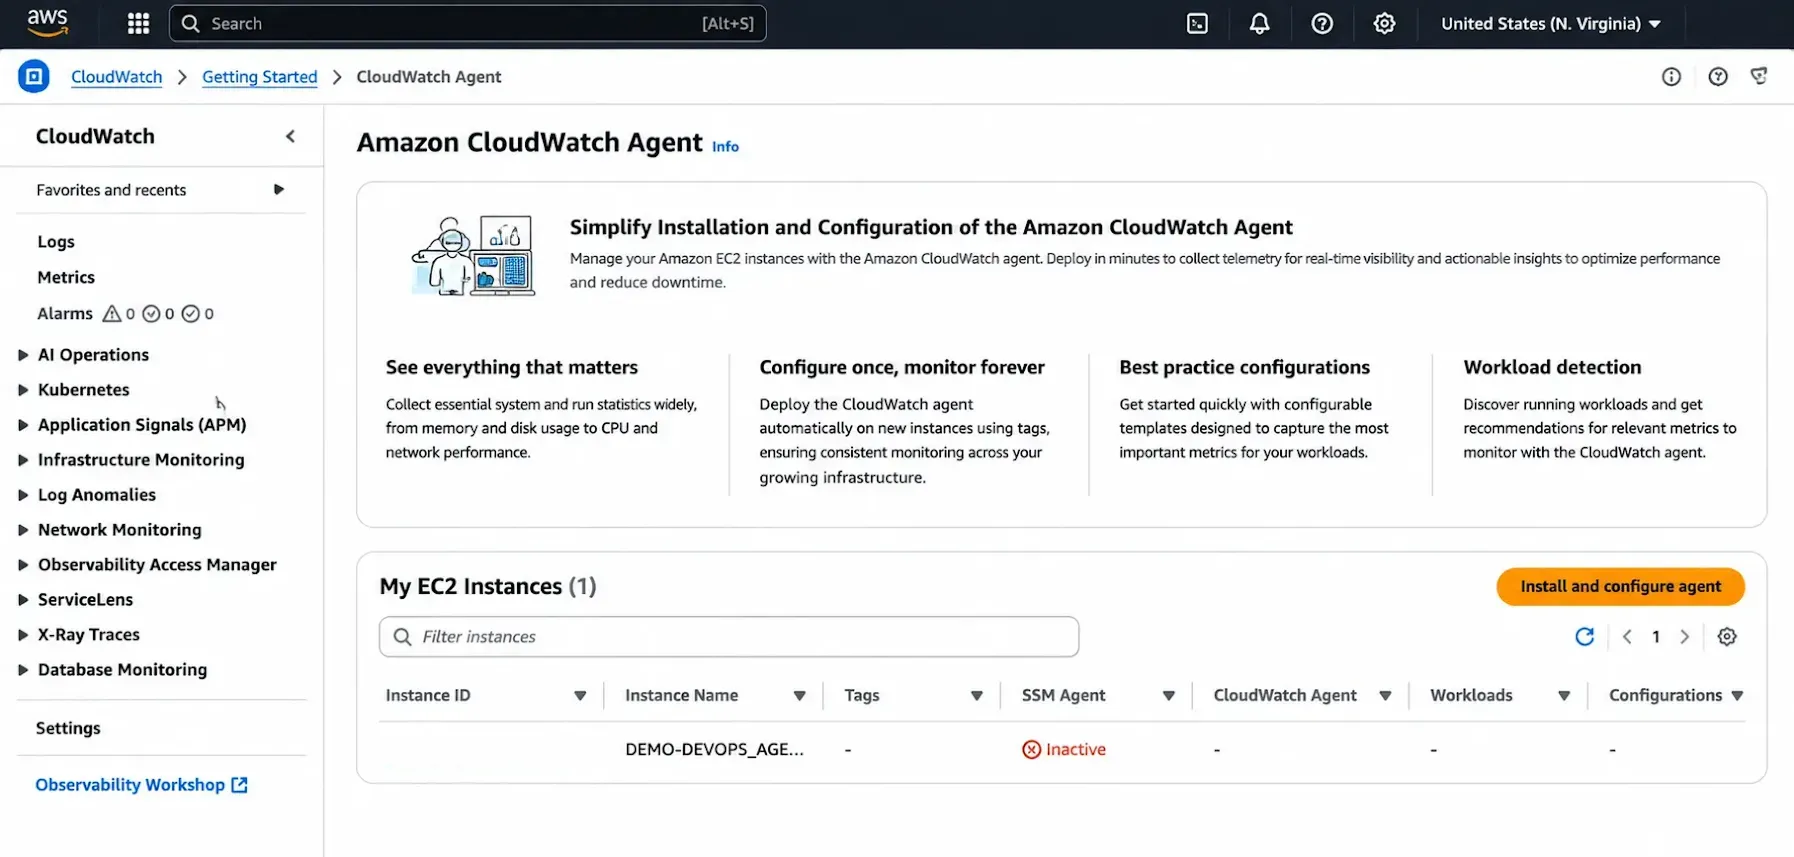
For example, you could configure an alarm that triggers when CPUUtilization remains above 80% for a defined evaluation period.
A high-CPU alarm provides an important operational signal. The alarm itself does not necessarily mean that the AWS DevOps Agent automatically starts an investigation. The agent can use the alarm, metrics, logs, and related AWS resources as context when an investigation is initiated.
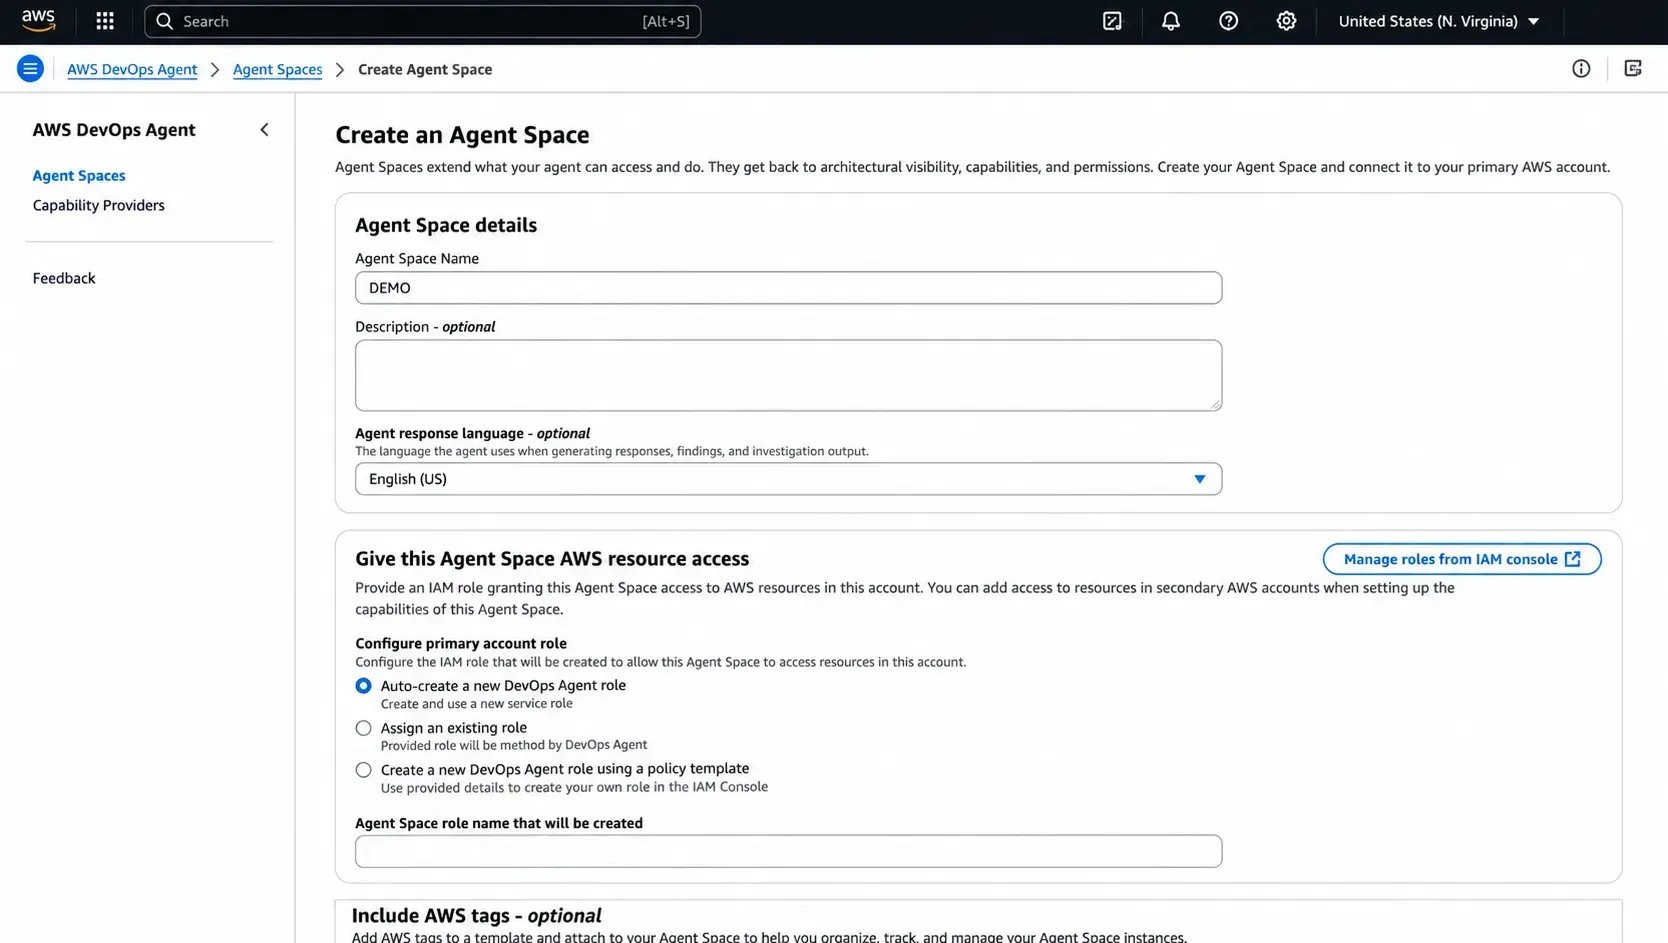
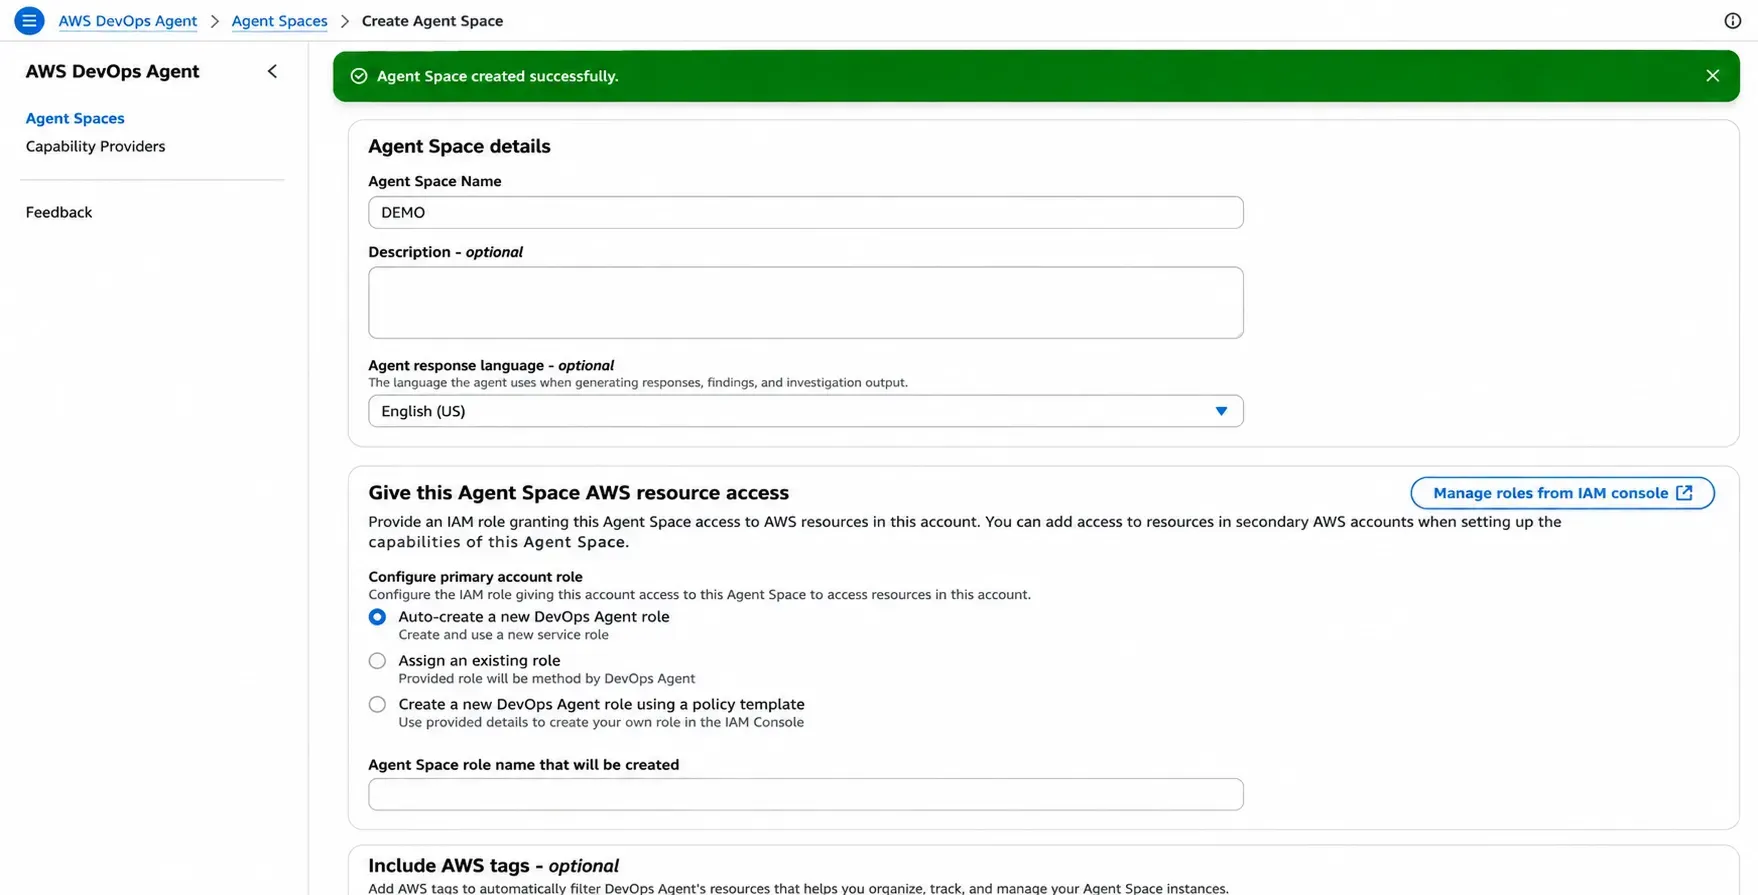
Step 3: Create an AWS DevOps Agent Space
The next step is to create an Agent Space.
An Agent Space provides a logical boundary for the AWS resources, accounts, tools, and permissions available to the AWS DevOps Agent.
During configuration, you can select the language in which you want the AWS DevOps Agent to provide its responses.
For example:
- Agent Space: Production-DevOps
- Environment: Production
The Agent Space helps define the operational context in which investigations are performed.
Step 4: Configure IAM Permissions
IAM is a critical part of the AWS DevOps Agent setup.
The agent needs appropriate permissions to access the AWS resources and operational information required for an investigation.
Follow the AWS-provided IAM configuration and permission requirements for the Agent Space, and apply the principle of least privilege wherever possible.
Depending on the configuration and investigation requirements, access may include resources such as:
Amazon CloudWatch
Used to access monitoring information such as:
- Metrics
- Alarms
- Monitoring data
Amazon EC2
Used to inspect information about:
- EC2 instances
- Instance configuration
- Instance state
- Related infrastructure information
CloudWatch Logs
Used to analyze available:
- Application logs
- System logs
- Operational logs
Other AWS Services
Additional AWS services may need to be accessible when they are relevant to understanding the application's architecture and dependencies.
For example, an application investigation may require visibility into an ALB, RDS database, ECS service, Lambda function, or other AWS resource.
Important: Avoid granting unrestricted administrative permissions simply to make the initial setup easier. For production environments, IAM permissions should be reviewed carefully by your security or cloud governance team.
Step 5: Associate the AWS Account
After creating the Agent Space, associate the AWS account containing the workloads and AWS resources that you want the agent to investigate.
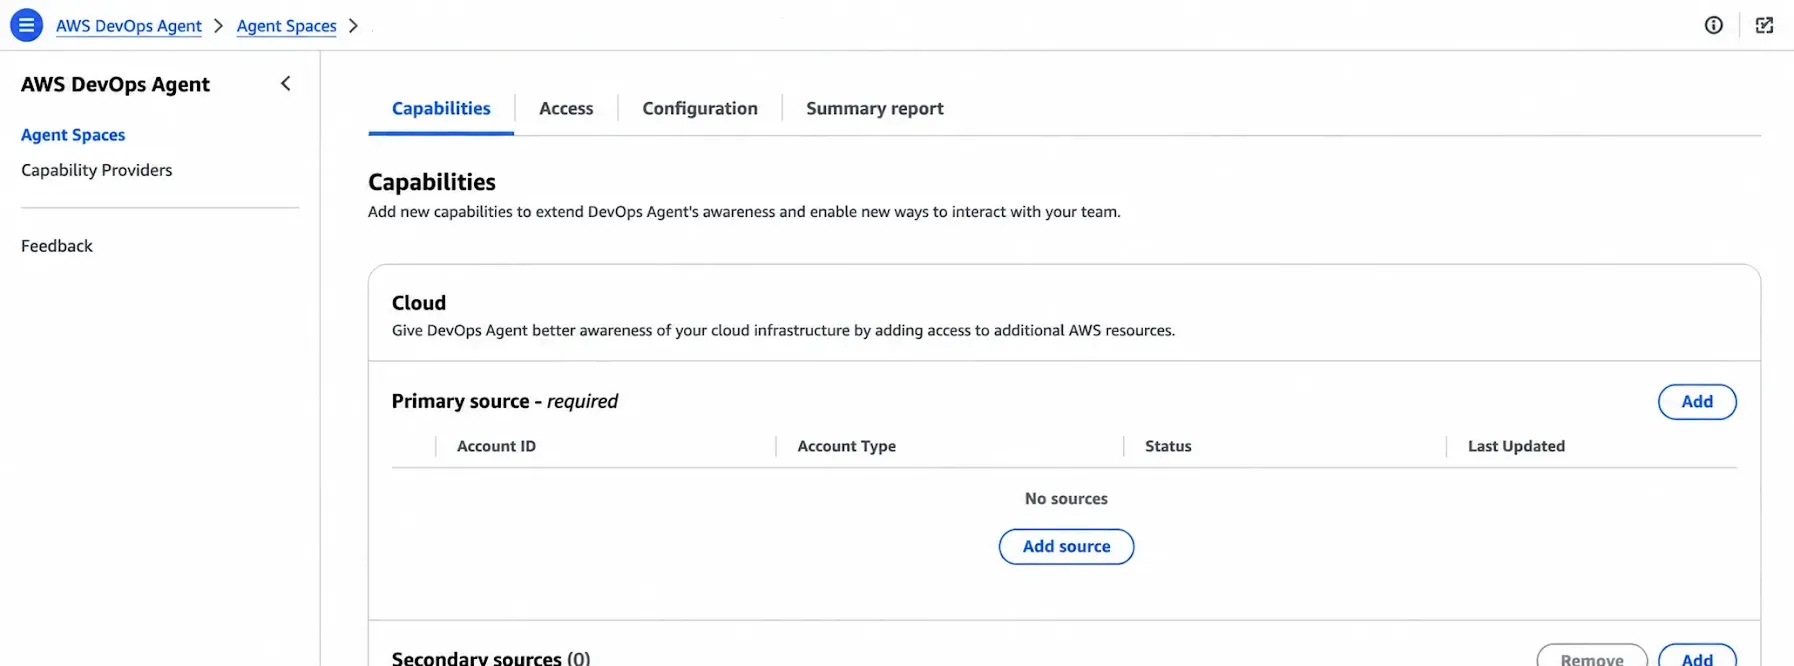
The important point is that the agent is not simply connected to one EC2 server.
It operates within the AWS environment made available to the Agent Space through the configured account access and permissions.
Step 6: Access the DevOps Agent Web App
After the Agent Space and required access have been configured, authorized operators can access the AWS DevOps Agent web application.
The web application provides an interface for performing operational investigations using natural-language requests.
Instead of manually opening multiple monitoring dashboards and searching through different logs, an engineer can ask the agent to investigate an incident.
For example, after a CloudWatch alarm indicates unusually high CPU utilization, an engineer can ask the AWS DevOps Agent:
"Investigate the high CPU incident on EC2-02. Identify the probable root cause and determine whether a recent deployment contributed to the issue."
When an investigation is initiated, the AWS DevOps Agent can use the operational information available within its configured environment to investigate the issue. This may include EC2 information, CloudWatch metrics, available logs, related AWS resources, and recent changes, depending on the configured permissions and integrations.
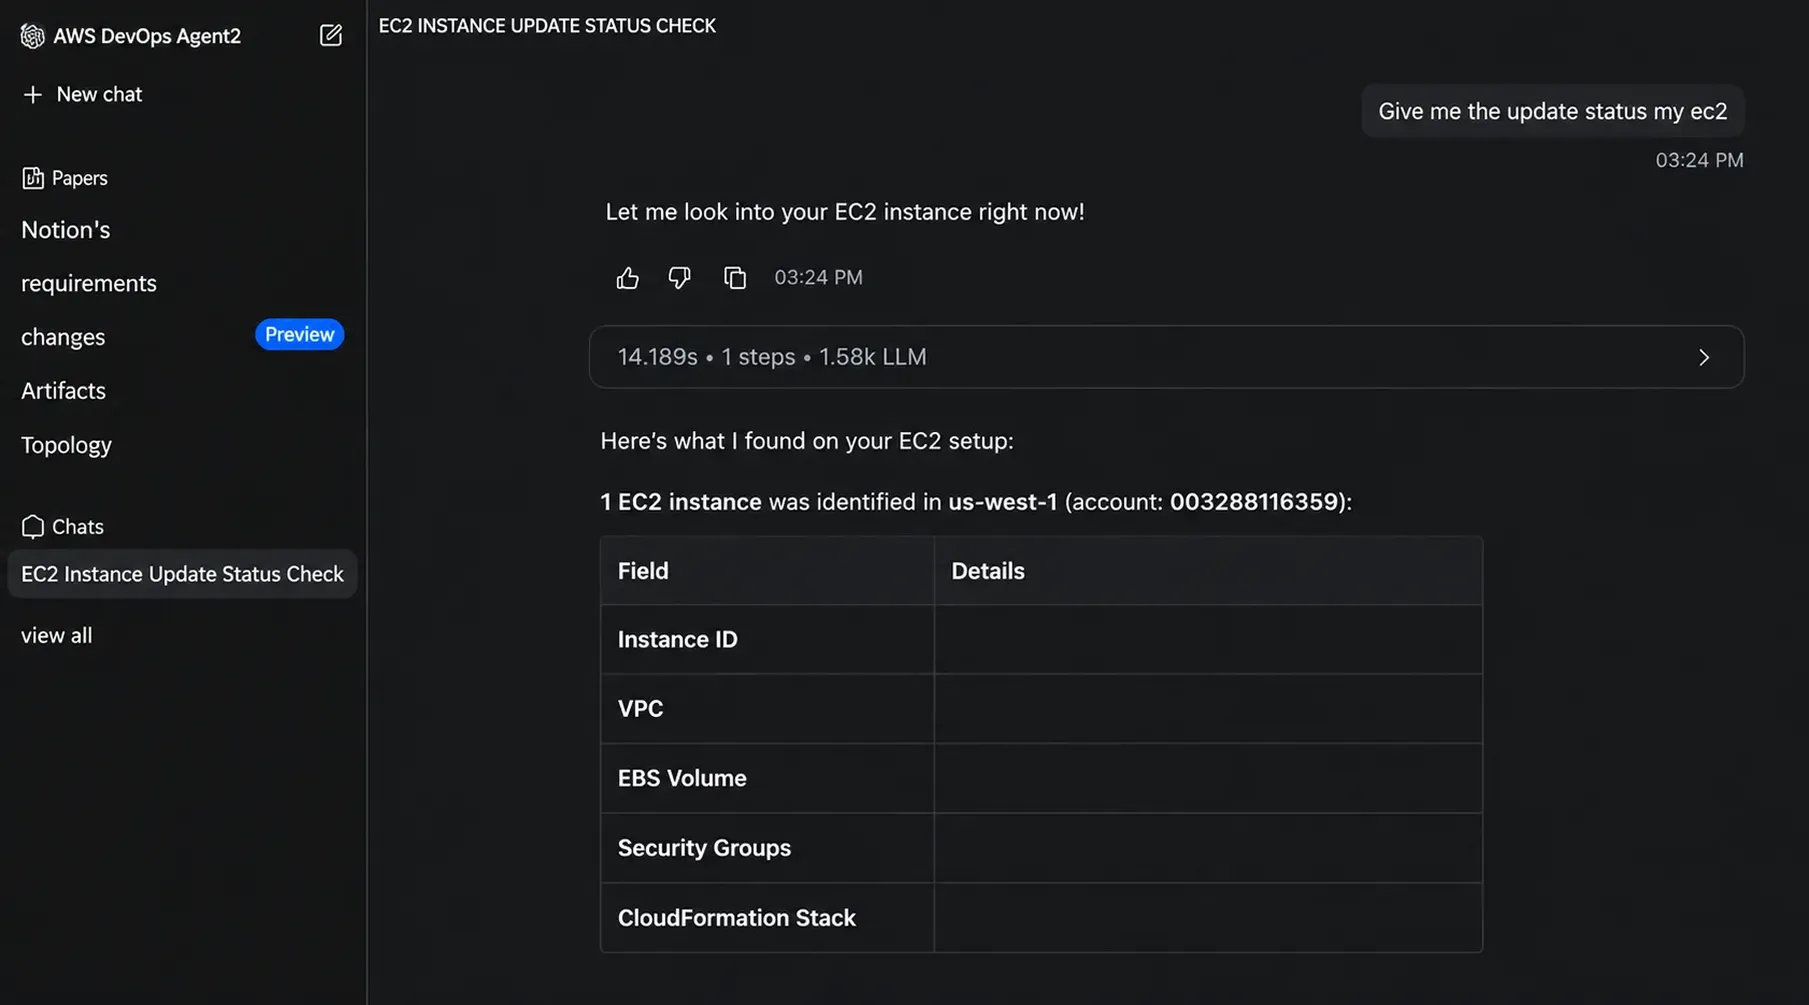
A typical investigation flow can be represented as:
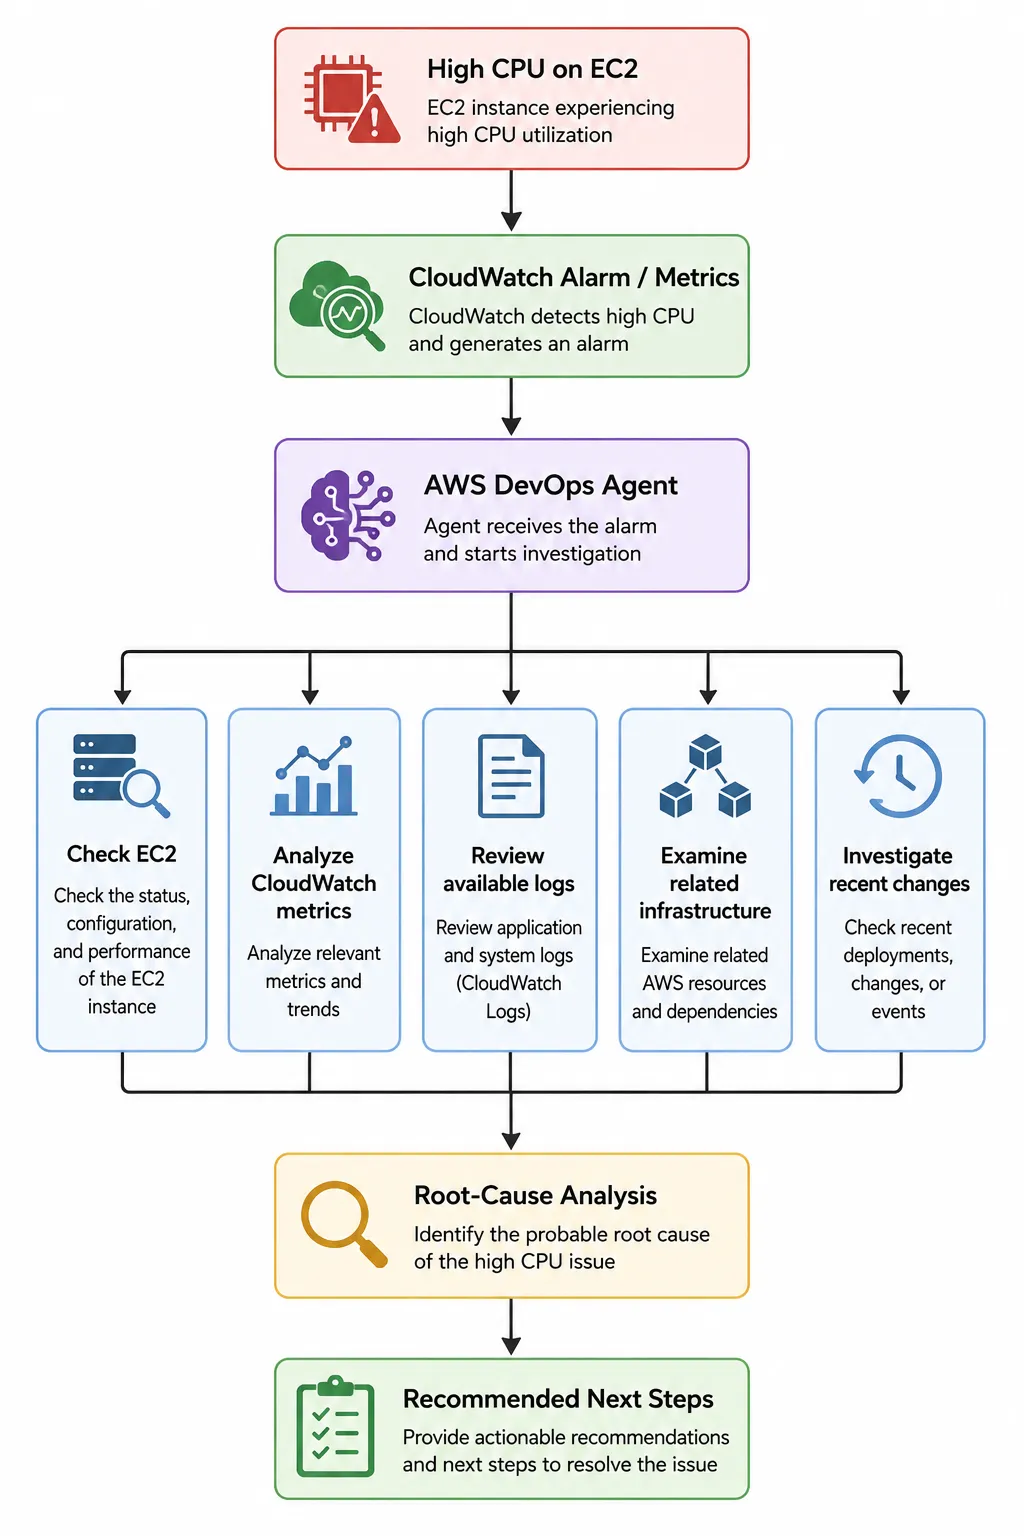
This is one of the key differences between an AI-assisted operations workflow and traditional monitoring.
Traditional monitoring primarily tells engineers what is happening.
An AI-powered operational workflow can help engineers investigate why it is happening, correlate information across the environment, and determine what should be investigated next.
The quality of the investigation, however, depends on the resources, telemetry, integrations, account access, and IAM permissions available to the AWS DevOps Agent.
Clean Code vs. Overengineering: Where Should Developers Draw the Line?
Clean code reduces unnecessary complexity; overengineering invents it. A practical guide to using context, evidence, and the cost of change to know when to stop adding abstractions...
Read More
Kafka vs RabbitMQ vs AWS EventBridge: Choosing the Right Architecture Based on Business Requirements
Compare Kafka, RabbitMQ, and AWS EventBridge based on scalability, routing, event streaming, replay, infrastructure, and business requirements to choose the right architecture...
Read More
AI Integrations for QA Engineers
Learn how QA engineers can connect AI with Jira, GitHub, Slack, Notion and other tools to improve testing, bug tracking, reporting and QA productivity...
Read More
The Ultimate Guide to Amazon SES Setup with GoDaddy DNS
Learn how to set up Amazon SES with GoDaddy DNS. Complete step-by-step guide covering Easy DKIM, SPF, DMARC, custom MAIL FROM, and exiting the SES Sandbox...
Read More
Multi-Tenancy Patterns in DynamoDB: Silo, Pool, and Bridge Models
If you've already made the jump from a relational database to DynamoDB see our guide on moving relational data from SQL to DynamoDB...
Read More
We stopped leaving the IDE to design. Here’s our Cursor → Figma flow
Cursor drafts fast, catches gaps early, and still clips fields and breaks layouts. Here's the real pros-and-cons breakdown of our workflow...
Read More
AWS DevOps Agent: How AI is Automating On-Call Incident Response
If you've ever been on call during a production outage, you know how stressful it can be. Alerts start firing, dashboards light up, and suddenly you're jumping between monitoring tools...
Read More
Catch Missing Images Before Deploy: A Simple Pre-Build Script for Next.js
How Omax Tech added a lightweight image validation gate to Next.js 15 builds on Vercel...
Read More
Teach your LLM your design system: Storybook MCP + Amazon Bedrock + Strands
How to stop models inventing buttons and make them build UI from your real component catalog. Most "AI UI" demos look great until you paste the markup into a real product. The fix is not a smarter prompt...
Read MoreReady to Work With Us?
Most engagements start with a 20-minute conversation. No pitch, no pressure - just an honest discussion about what you're building and whether we're the right fit.